Venue Condition Mapping Across Outdoor Leagues Exposes Strategic Patterns
Vera Flores · Jul 12, 2026
Venue Condition Mapping Across Outdoor Leagues Exposes Strategic Patterns
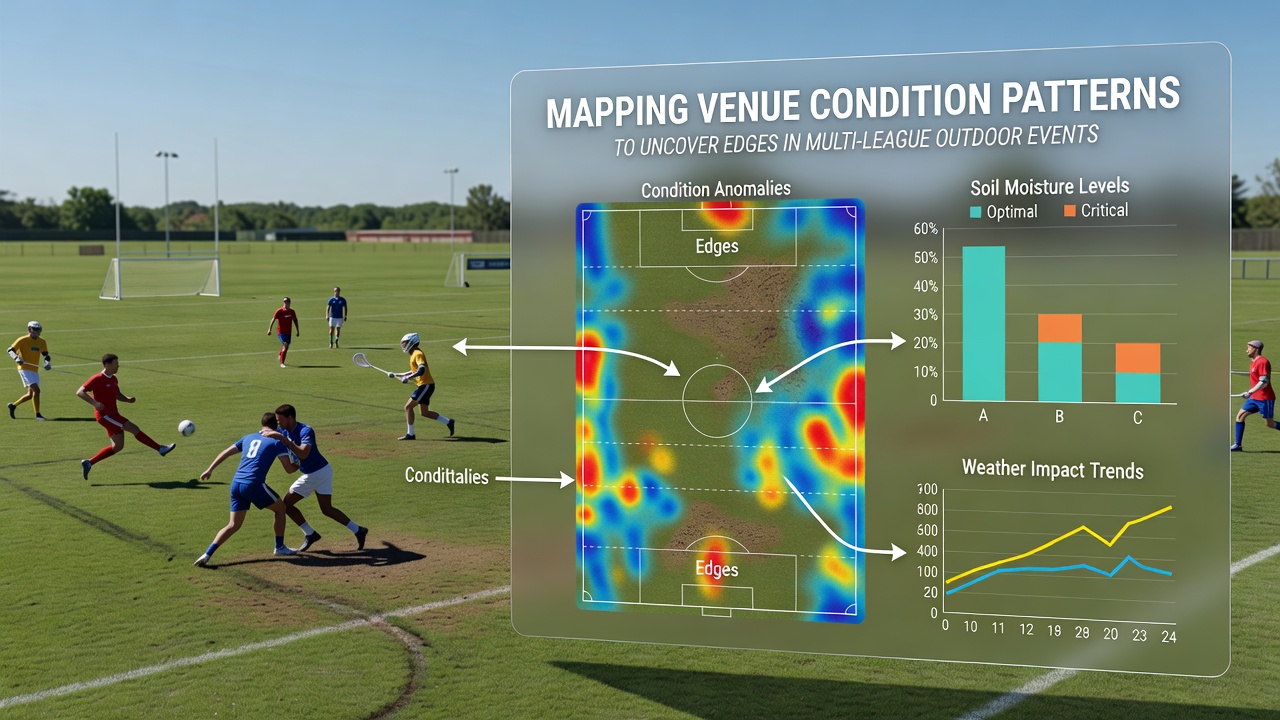
Venue condition mapping has emerged as a focused discipline among analysts who track outdoor events spanning soccer, baseball, tennis and rugby competitions. Observers note that temperature shifts, precipitation levels, wind speeds and field surfaces create measurable influences on performance metrics across these leagues, and data collection now integrates satellite feeds with on-site sensors to build layered profiles for each location. Researchers compile these variables into pattern grids that highlight repeatable scenarios, such as elevated error rates during humid afternoon sessions at specific stadiums or altered passing accuracy when crosswinds exceed thresholds documented in league archives.
Data Layers That Shape Pattern Recognition
Analysts combine historical weather records with real-time surface readings because single-source inputs often miss interactions between factors like humidity and grass length. Organizations such as the National Oceanic and Atmospheric Administration supply granular forecasts that feed into models tracking how dew point changes affect ball grip in baseball and soccer alike. Meanwhile surface specialists measure infill depth on artificial pitches and moisture retention on natural grass, producing datasets that reveal consistent edges when teams face similar conditions at recurring venues. These combined layers allow pattern detection across multiple leagues rather than isolated sport silos.
Cross-League Comparisons Yield Repeatable Indicators
Multi-league datasets show that certain venues produce parallel effects despite differing rulesets. One study tracked wind patterns at coastal baseball parks and riverside soccer fields, finding comparable reductions in long-range accuracy during sustained gusts above 15 miles per hour. Observers have documented how altitude venues in South American and European competitions alter endurance metrics in comparable ways during summer schedules, while precipitation thresholds trigger similar play-style shifts in rugby and tennis matches. Pattern grids therefore flag shared risk windows, such as late-afternoon humidity spikes that coincide with elevated injury reports across leagues in July 2026 schedules.
Implementation Steps for Pattern Application
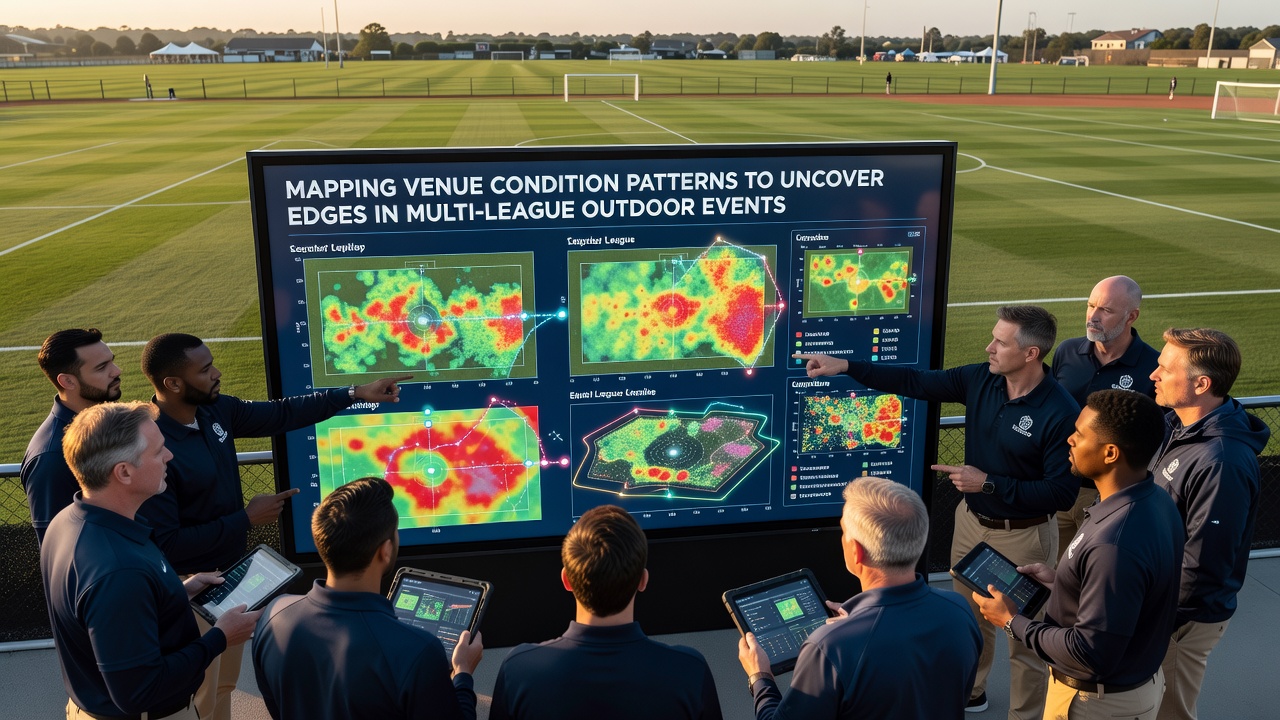
Teams and analysts begin by standardizing venue profiles through uniform data fields that capture elevation, orientation, turf type and prevailing wind corridors. They then overlay historical performance statistics filtered by those exact conditions, creating baseline expectations before each event window. Software platforms aggregate these inputs into visual heat maps that update as new readings arrive, allowing rapid identification of deviations from established norms. European Centre for Medium-Range Weather Forecasts data streams integrate directly into these systems, supplying extended outlooks that support pre-event adjustments for multi-league calendars spanning several time zones.
Seasonal Variables in July 2026 Contexts
July schedules introduce distinct variables because peak summer conditions amplify surface heat retention and humidity persistence at many outdoor sites. Records indicate that venues with limited shade structures record higher fatigue markers in afternoon blocks, while northern latitude locations experience extended daylight that delays cooling cycles. Pattern mapping captures these seasonal signatures by comparing July metrics against shoulder-month baselines, revealing edges when events cluster at venues that historically favor certain recovery timelines between consecutive days of competition.
Challenges in Maintaining Data Integrity
Consistency across sources remains a core requirement because sensor calibration differences can distort cross-league comparisons. Analysts address this through periodic validation against manual field reports and standardized calibration protocols adopted by multiple governing bodies. Incomplete historical records at newer venues also require cautious extrapolation, prompting teams to weight recent data more heavily until multi-year baselines accumulate. Despite these hurdles, integrated mapping continues to expand because the resulting pattern clarity supports more precise preparation across diverse outdoor formats.
Conclusion
Venue condition mapping consolidates disparate data streams into actionable pattern frameworks that span multiple outdoor leagues. Continued refinement of sensor networks and forecast integration promises tighter correlations between environmental variables and performance outcomes, while seasonal monitoring in periods such as July 2026 adds temporal depth to existing models. The approach equips analysts with structured methods for identifying repeatable indicators without reliance on isolated sport perspectives.